Shihai [ElevenX]
Shihai Shihai is your complete tool for analyzing market structure using multi-timeframe EMAs, sentiment-based bias signals, and dynamic level tracking.
Key Features
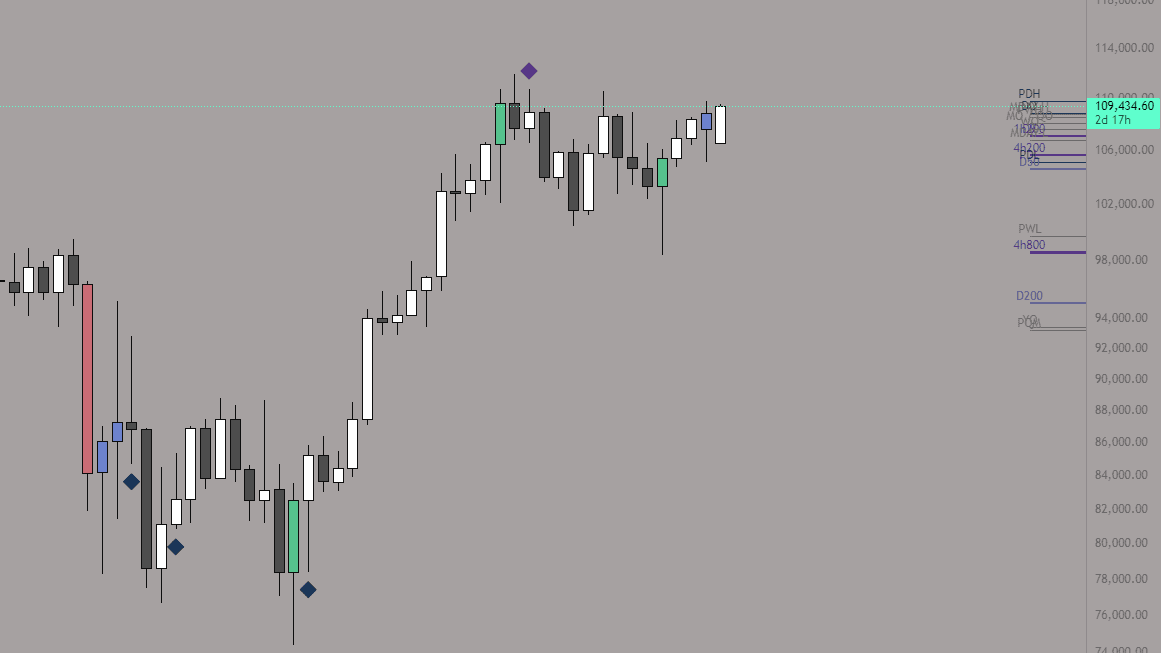
- Bias Signals: Shows bullish/bearish sentiment using configurable sensitivity and symbol crossreference.
- Multi-Timeframe EMAs: Plot fast/slow bands across 1h, 4h, and daily charts - fully customizable.
- Dynamic Key Levels: Auto-display open, previous H/L, and range levels across daily -> yearly.
- Custom EMA Zones: Define your own EMA and visualize it with optional dynamic zones.
- Bonus Tools: Experimental vectors, aVWAPs, and nPOCs for deeper structure insight.
Settings Overview
All Shihai settings are grouped into the following sections:
1. Signal Logic
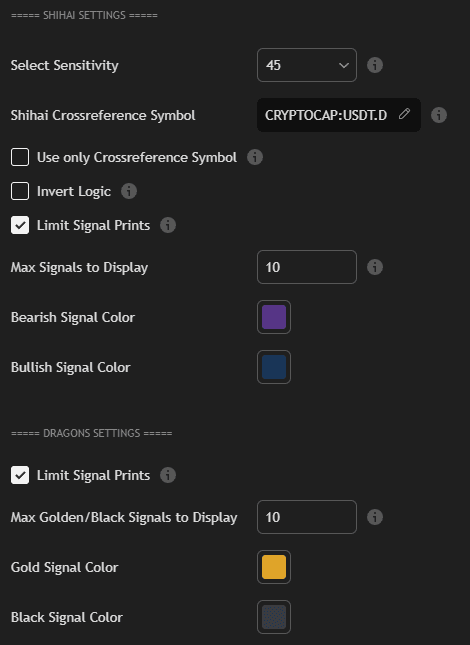
- Select Sensitivity: Controls how reactive the signal logic is.
- Crossreference Symbol: Pull sentiment from another chart (e.g. USDT.D).
- Invert Logic: Flip signal direction.
- Limit Signal Prints: Restrict signals per chart view.
- Signal Colors: Define separate styling for bullish/bearish markers.
2. EMA Display
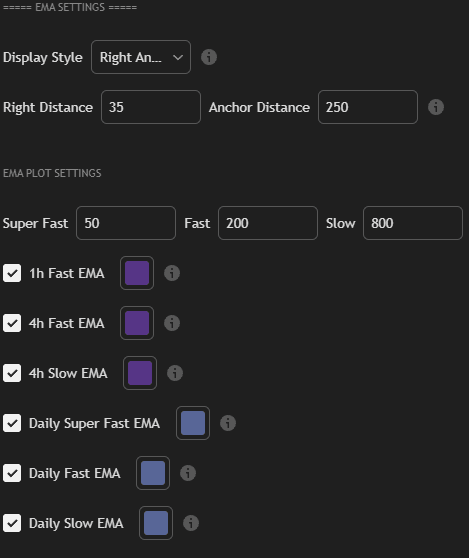
- Fast/Slow/Super Fast: Input your preferred EMA lengths.
- Timeframe-Specific Toggle: Enable EMAs per timeframe (1h, 4h, Daily).
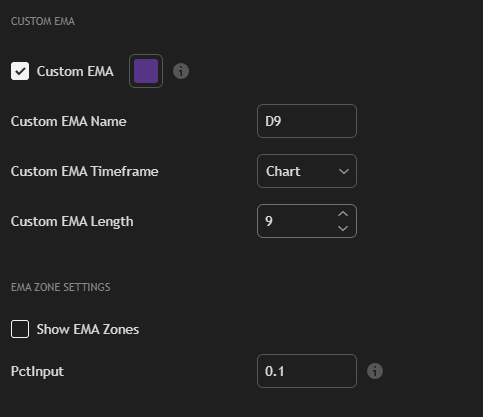
- Custom EMA: Plot any EMA by name, TF, and length.
- EMA Zones: Optional zone band around your custom EMA (based on % distance).
3. Key Levels
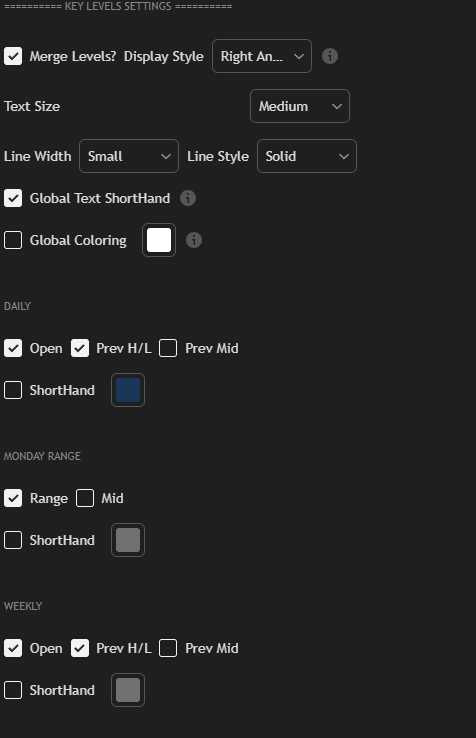
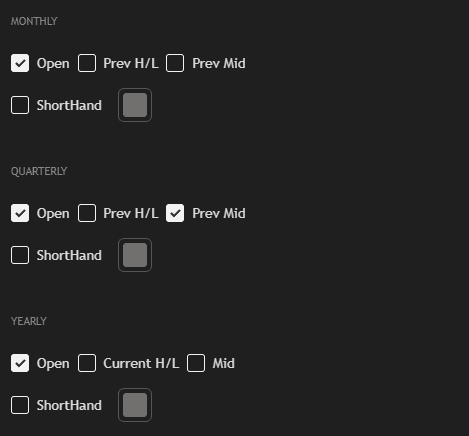
- Level Types: Daily, Weekly, Monthly, Quarterly, Yearly.
- Toggle Ranges, Mid, H/L: Select which sub-levels to show.
- Text ShortHand: Use compact labels instead of full text.
- Global Styling: Adjust size, color, line style/width across all levels.
4. Styling & Vectors
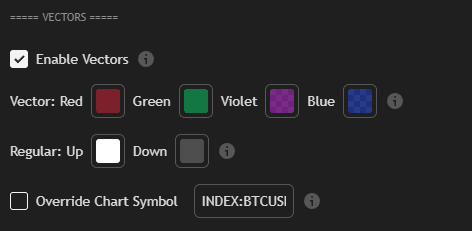
- Vector Colors: Use up to 4 directional arrows with unique colors.
- Regular Arrows: Optional white/gray up/down signals.
- Override Chart Symbol: Visualize logic from another ticker while keeping main chart clean.
5. Experimental (aVWAP & nPOC)
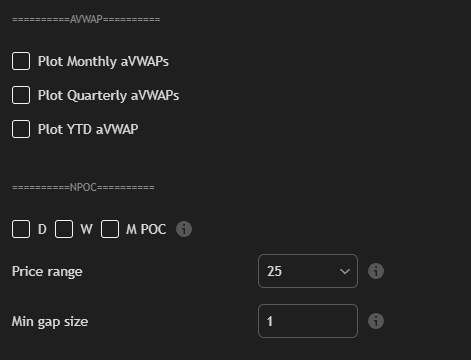
- aVWAP: Plot monthly, quarterly, or YTD anchored VWAPs (optional).
- nPOC: Show developing naked point of control levels from daily to monthly.
- Price Range / Gap Size: Fine-tune how POC clusters are displayed.
- Note: These features are experimental and may evolve in future versions.
How to Use Shihai
- Open your TradingView chart and add the Shihai [ElevenX] indicator.
- Set your desired Sensitivity for signal behavior and (optionally) crossreference symbol.
- Enable and configure the EMAs you want to display (e.g. 1h fast + daily slow).
- Turn on key levels for your preferred timeframes (daily -> yearly).
- Use the bias, levels, and zone visuals to assess market control, pullbacks, or confluence.
Shihai is ideal for traders who want multi-layered confirmation using clean visuals, bias signals, and structure-based overlays - all in one unified tool.