MTF OBIM [ElevenX]
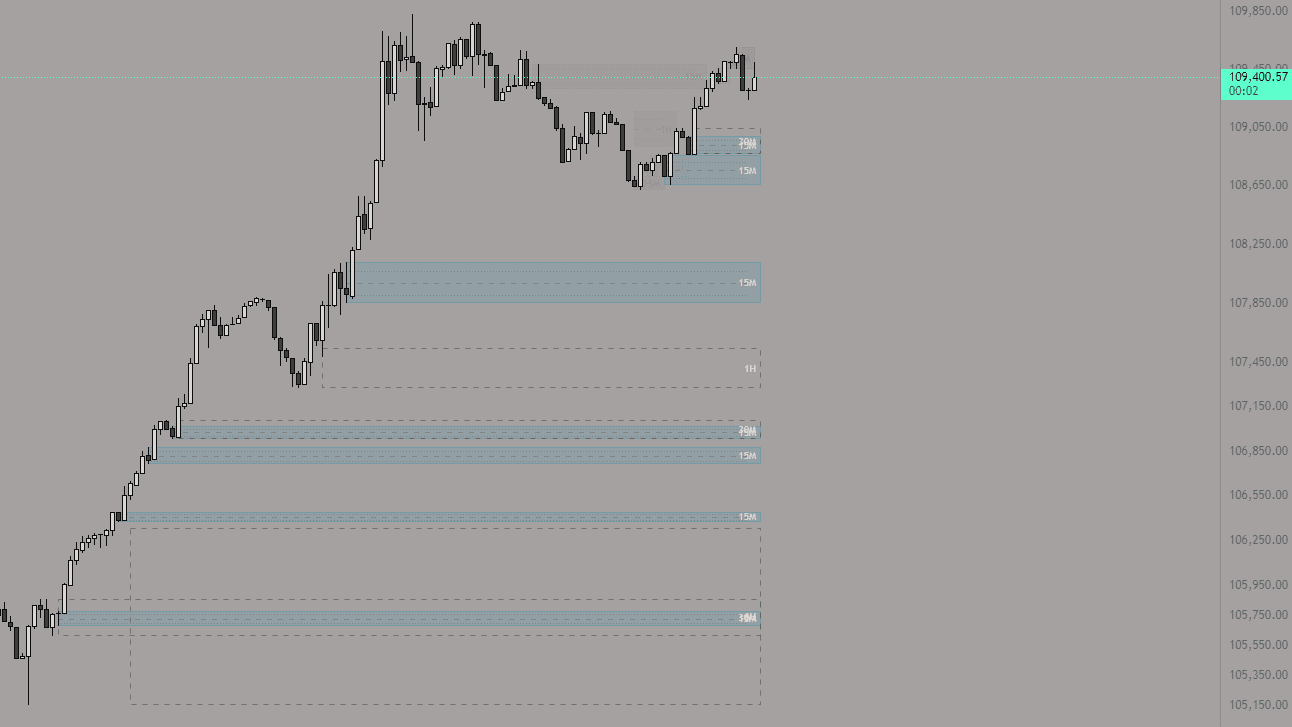
MTF OBIM MTF OBIM visualizes order blocks across multiple timeframes - with rich color customization, dynamic zone tracking, and retracement-level overlays.
Key Features
- Dynamic Order Blocks: Identify bullish/bearish OBs using wick or body logic.
- Mitigation Logic: Highlight mitigated zones with optional candle tracking.
- Retracement Levels: Show key levels (21%, 50%, 78%) for OB-based entries or reactions.
- Multi-Timeframe Support: Analyze up to 5 timeframes with full control over visibility and color.
Settings Overview
All customizable input options for MTF OBIM are listed below:
1. General & OB Settings
Adjust how order blocks are detected and displayed in real time.
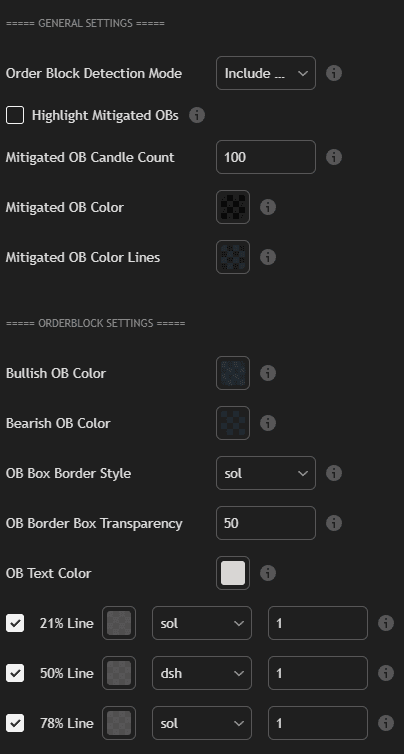
- Detection Mode: Include/exclude wicks for OB calculation.
- Mitigated OB Tracking: Highlight OBs that have already been mitigated by price action.
- Mitigated Candle Count: Number of candles to consider when tracking mitigation.
- Bullish/Bearish OB Colors: Custom color styling per OB direction.
- OB Border Style & Transparency: Adjust visibility and style (solid, dashed).
- Retracement Lines: Toggle 21%, 50%, and 78% with independent styles and thickness.
2. Custom OB Timeframes
Enable and configure additional OB detection across multiple timeframes.
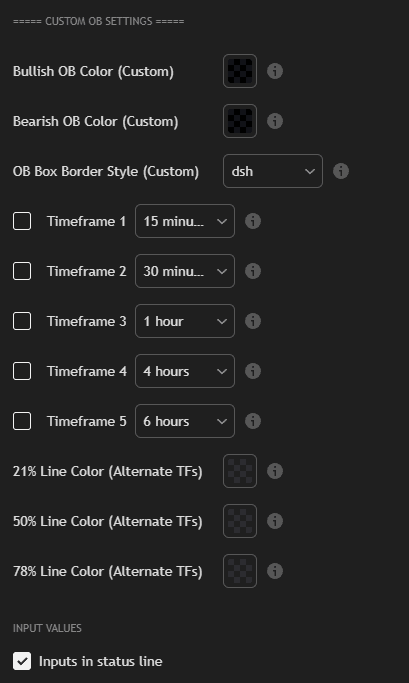
- Custom OB Colors: Separate visual treatment for alternate timeframe OBs.
- Custom Border Style: Choose solid/dashed for custom OB box outlines.
- Enable Timeframes: Add up to 5 custom TFs (e.g. 15m, 1h, 4h, etc.).
- Retracement Line Colors: Adjust 21%, 50%, 78% line color for custom TFs.
How to Use MTF OBIM
- Open any TradingView chart and add the MTF OBIM [ElevenX] indicator.
- Choose your preferred OB Detection Mode (wicks vs. bodies).
- Enable Mitigated OBs if you want previously tapped blocks highlighted.
- Scroll down and activate Custom Timeframes to add additional structure context (15m-6h).
- Customize colors, box styles, and retracement line types to suit your chart theme.
Once set up, the indicator will auto-plot relevant order blocks across your chosen timeframes - providing real-time structure, clean visuals, and clear zones for confluence-based entries or exits.